Key Findings
- Total Mass of Plastic Consumption Determined with Procurement Data | Over a five-year study period, Uppsala University (UU) laboratories purchased an estimated 390 tonnes of plastic, at a cost of 75.4 million SEK (≈$8.13 million USD) in laboratory consumables.
- Specific Product Categories Dominate Overall Plastic Use | The analysis demonstrates that just five product categories account for most of the lab plastic use.
- Targeted Interventions Can Deliver Significant Results | The study and this article demonstrate that simple, targeted actions focused on specific product categories can lead to impactful improvements in Scope 3 GHG emissions.
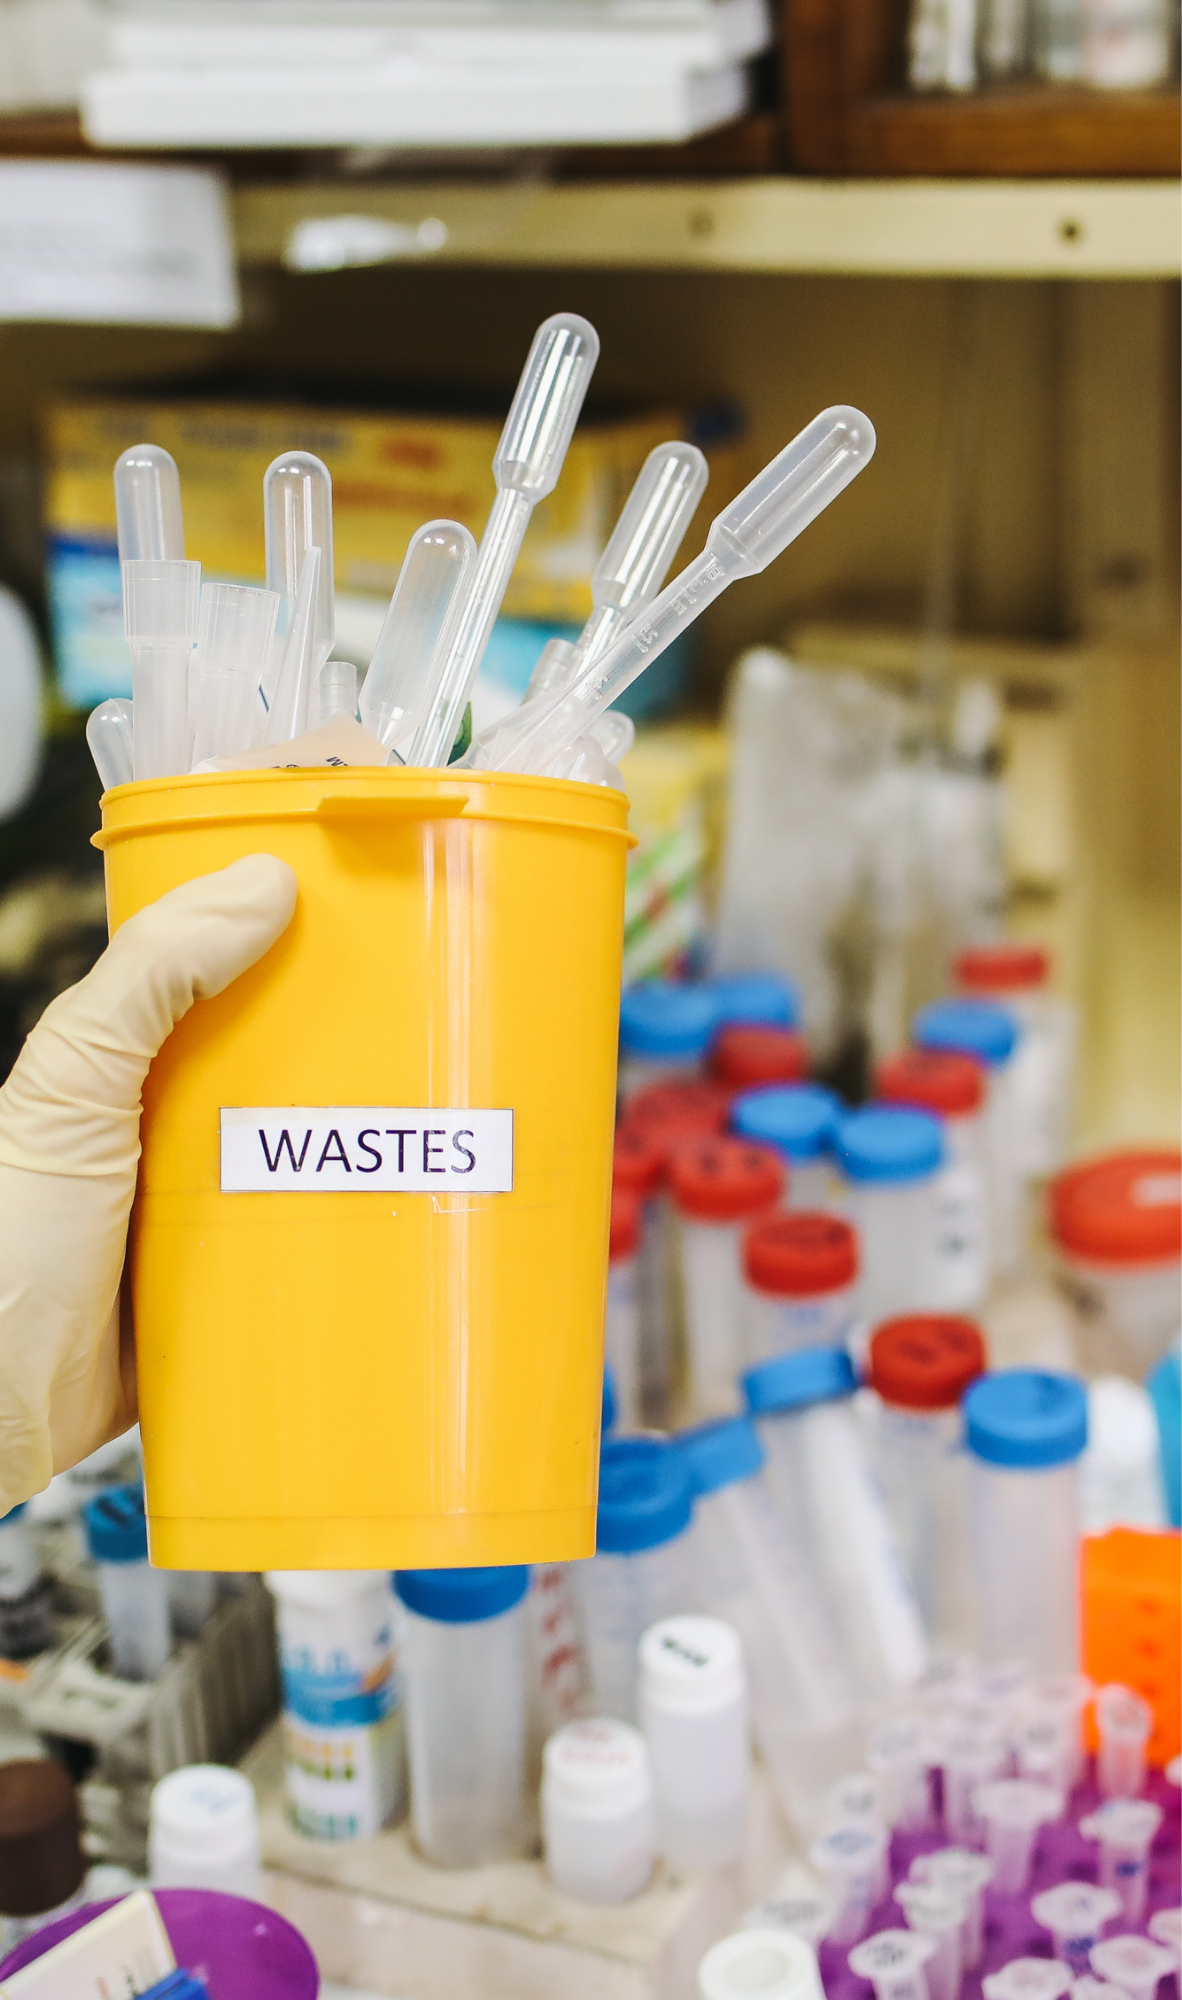
Plastic lab products are an integral part of most laboratory operations. They serve useful functions such as keeping work sterile and protecting personnel. Plastic lab products are also one of the biggest sources of waste in a laboratory, and this waste is sometimes difficult to quantify or track.
Globally, plastic production and disposal are responsible for ~3% of total GHG emissions (Ritchie, 2023). Available lab waste data suggests labs contribute significantly through single-use plastic consumables.
Depending on the lab type and research activity, published estimates suggest plastic waste generation may range from 60 kg to over 1,000 kg per scientist per year (Urbina, 2015; Howes, 2019).
Much of the ~5.5 million tonnes of single use plastic waste generated through lab research is managed through disposal pathways that generate high amounts of GHG emissions, making waste reduction a key lever for lowering emissions from labs (Urbina, 2015). These emissions are classified as indirect, or “Scope 3” GHG emissions according to the Greenhouse Gas Protocol. In the life sciences sector, Scope 3 emissions account for 75–88% of total emissions, highlighting the importance of reducing emissions associated with the purchase, use, and disposal of lab plastics (MGL, 2025).
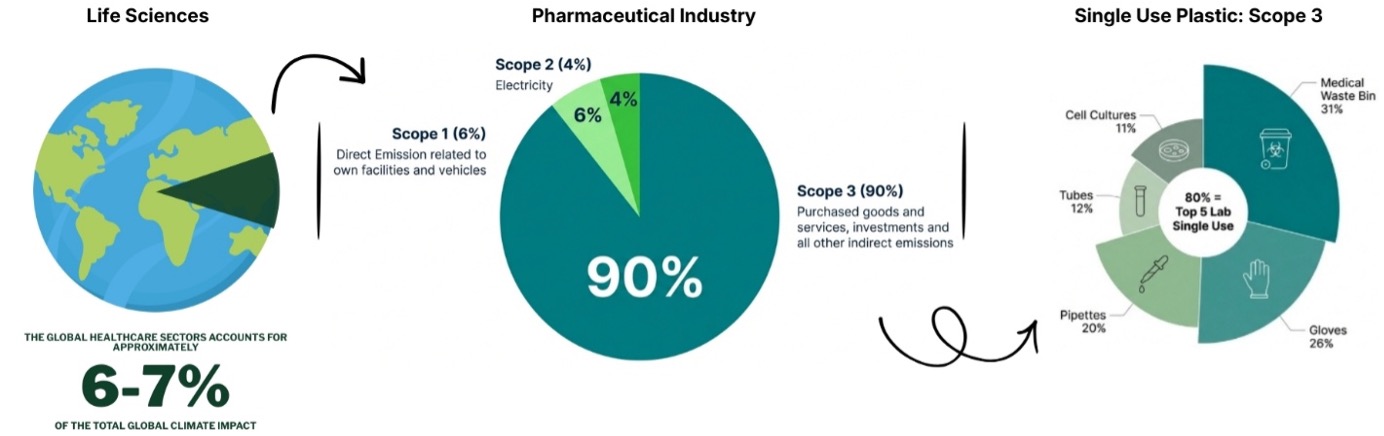
Figure 1: Scope 3 GHG emission proportion in pharmaceutical sector
A recent analysis from Uppsala University (UU) in Sweden examined five years of laboratory purchasing data (2020–2024), and the plastic mass used across thousands of products procured during this period.
While nearly 390 tonnes of plastic were purchased during the five-year period, most of it came from just a small number of product categories. This suggests a targeted strategy, focusing on just a few specific categories of products, can deliver meaningful reductions in both plastic waste and associated GHG emissions.
This article summarises the procurement-based approach and key findings from the UU analysis and highlights practical, lab-relevant actions to reduce single-use plastic and the associated Scope 3 GHG emissions.
The Approach: Using Procurement Data vs. Waste Audits
Waste audits and procurement data offer two different and complementary ways to understand plastic use in laboratories. The UU study focused on procurement-based data, supplemented with additional information.
- Procurement-based data tracks what is purchased over time, often providing multi-year data sets. Procurement-based data avoids the handling of potentially contaminated materials and captures the full count of lab products, including those items being stored and those not yet discarded. While this data does not track exact disposal timing, it reveals overall plastic consumption patterns at scale. Purchasing datasets often lack item weights. To support the study, the UU team manually classified hundreds of items and collected weight specifications directly from manufacturers. Many products were purchased in bulk, which required additional interpretation to determine actual unit counts.
- Waste audit–based data measures the actual plastic mass leaving a lab after use. By sorting and weighing items, a waste audit reveals disposal practices such as bin use and behaviour, classification of waste, and lab protocol practices. However, waste audits are labour intensive, limited only to waste produced during the time of the audit, and often exclude biohazardous materials that cannot be manually inspected safely.
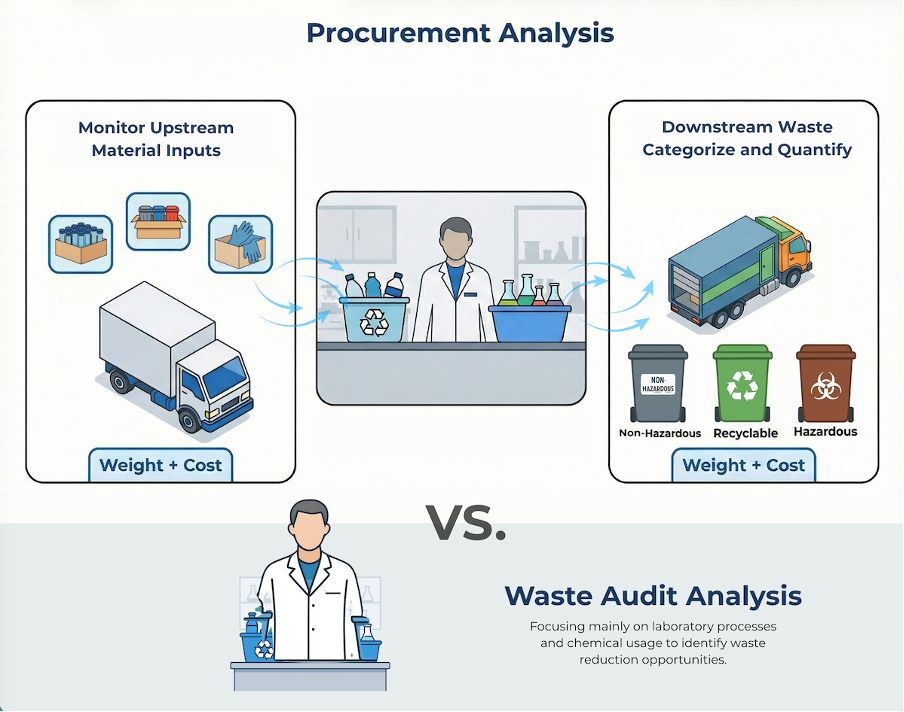
Figure 2: Procurement Analysis compared to Waste Audit Analysis
Only a limited number of waste audit studies have been published. The results align with the findings from UU using procurement analysis and point to the same conclusion: a small number of plastic-intensive items dominate in laboratory use (Weber, 2025; Nederveen, 2019). For labs, this gives clear direction on where to focus reduction efforts for the greatest impact on GHG reductions and improved sustainability.
One notable difference between the UU study and most traditional waste audit studies is the inclusion of clinical waste bins in the data. These items are often excluded during studies that use manual sorting. The UU procurement-based approach included the plastic mass of waste bins and revealed them to be the largest single contributor to plastic waste by weight.
Results and Opportunities
This study is based on laboratory procurement records from UU. In total, approximately 2,200 plastic products were used across UU laboratories from 2020-2024. Around 20% of products accounted for more than 80% of total plastic mass and spend. Identifying that a limited number of product categories are the biggest drivers of plastic consumption in labs is an important insight and opportunity, suggesting that simple and targeted actions can have a significant impact.
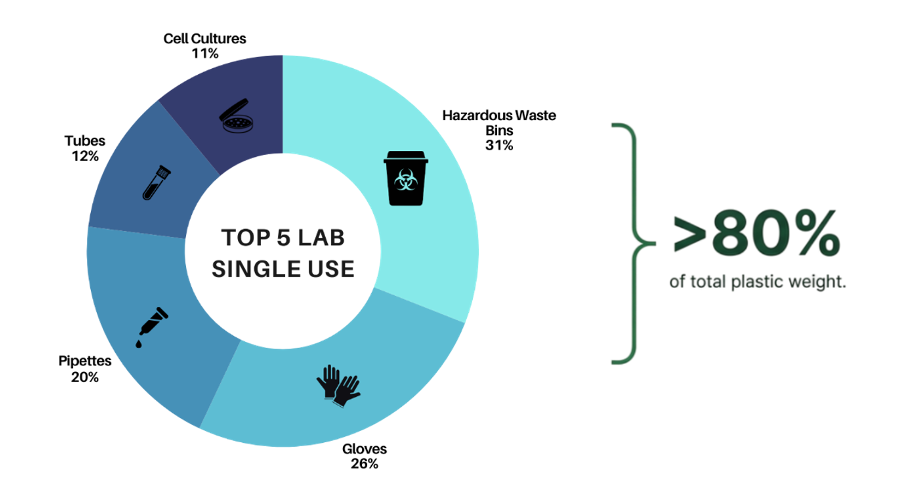
Figure 3: Top five Single-Use Plastic product categories at Uppsala University
The 5 Lab Product Categories Producing the Most Plastic Waste In This Study
Product Category: Hazardous Waste Bins
Hazardous waste bins emerged as the single largest contributor to plastic waste by total mass, despite being purchased in relatively modest unit quantities. This dominance is due to their high individual weight. Approximately 90% of the bins purchased were 50– to 60-liter models, each weighing ~1.5 kg, while smaller 25– to 30-liter bins weighed ~1.0 kg. Over the five-year study period, hazardous waste bins accounted for 89,425 kg of plastic, more than any other product category.
Opportunities
These containers are essential for handling regulated hazardous waste and are ultimately incinerated in the waste system used by UU, so reduction opportunities do not include eliminating their use. Instead, the optimization of waste practices can lead to fewer bins being used. Strategies can include improving waste classification to avoid unnecessary disposal into hazardous bins, rightsizing bin usage by selecting larger bins instead of multiple smaller ones, and exploring reusable bins or bins made of alternative materials with reduced carbon impact, such as bio composite material that can reduce associated GHG emissions 66% as compared to traditional polypropylene bins (WoodSafe, 2026).
Product Category: Gloves
Gloves were the second-largest contributor by mass, reflecting very high usage across laboratories. Each nitrile glove weighs ~6 grams, with an estimated annual usage exceeding 2.8 million gloves, equivalent to roughly 11,250 gloves per working day at UU. Over the five-year period, gloves accounted for 84,437 kg of plastic. Reduction efforts for gloves are challenging due to biosafety requirements, and nitrile (a relatively high carbon material compared to alternatives) remains the preferred material for most hazardous laboratory tasks.
Opportunities
Improved glove use technique through training, behaviour change initiatives, choosing lower weight nitrile gloves, and reusing gloves for non-hazardous tasks where appropriate can improve the environmental impact of lab activities that require gloves. In addition, where the hazard risk level permits, laboratories may consider switching to less carbon intensive glove materials like vinyl as an additional reduction strategy.
Product Category: Pipette Tips
The study identified 503 unique pipette tip products, covering both filtered and nonfiltered varieties, sourced from multiple vendors. For the study, tips were grouped into three standard volume classes: small (10 µL, 0.12 g), medium (100 µL, 0.33 g), and large (1000 µL, 0.77 g). Over the five-year period, pipette tips contributed 49,806 kg of plastic waste, with medium and large tips comprising most of the weight.
Opportunities
Notably, pipette tips constitute a major plastic category not because they are individually heavy, but because of the extremely high number of units consumed daily. This highlights several opportunities for reduction, including adopting tip reuse systems such as automated tip washers, and shifting to refill and reload systems. Designing experiments to reduce unnecessary pipetting steps and using the smallest tip necessary for the volume requirements of each experiment also contribute to reduced environmental impact from plastic waste.
Product Category: Tubes
The tubes category included 341 unique items, including microtubes, centrifuge tubes, cuvettes, and tubes with various closure mechanisms. The study grouped tubes into two broad subcategories: small tubes (<10 mL) and large tubes (>10 mL). Small tubes were assigned a representative weight of 2.8 g, while large tubes were assigned a representative weight of 12.8 g, based on supplier examples. The total plastic mass for the category was substantial, with large tubes contributing 31,233 kg and small tubes 17,436 kg for a total of 48,669 kg. Although small tubes were purchased in greater numbers, the heavier weight of large tubes drove their disproportionately large contribution to overall waste.
Opportunities
Selecting smaller volume tubes to match the volume requirements of the experiment, reusing tubes in non-sterile or low-risk workflows, choosing lower impact materials such as bioplastic tubes where available, and shifting to lighter weight tubes to reduce plastic use all contribute to lower environmental impact.
Product Category: Cell Culture Consumables
Cell culture items represented a diverse and relatively high plastic mass group, including culture plates, flasks, storage plates, cell scrapers, Petri dishes, and PCR/microplates. These items collectively contributed 19,966 kg of plastic over five years. Many of these products are inherently higher mass due to structural requirements for sterility and rigidity.
Opportunities
Cell culture work generates disproportionately large amounts of waste, and reduction opportunities include centralizing cell culture facilities, reducing culture vessel volume, and transitioning to reusable glassware where feasible.
Recommended Actions to Reduce Plastic Use in Laboratories
Based on the results of the study, several practical opportunities exist to reduce the environmental impact of lab plastic consumables. Any plastics reduction strategy should be grounded in the preferred waste hierarchy order of Replace, Reduce, Reuse, and Recycle (Figure 4), with recycling only used after the exploration of other options.
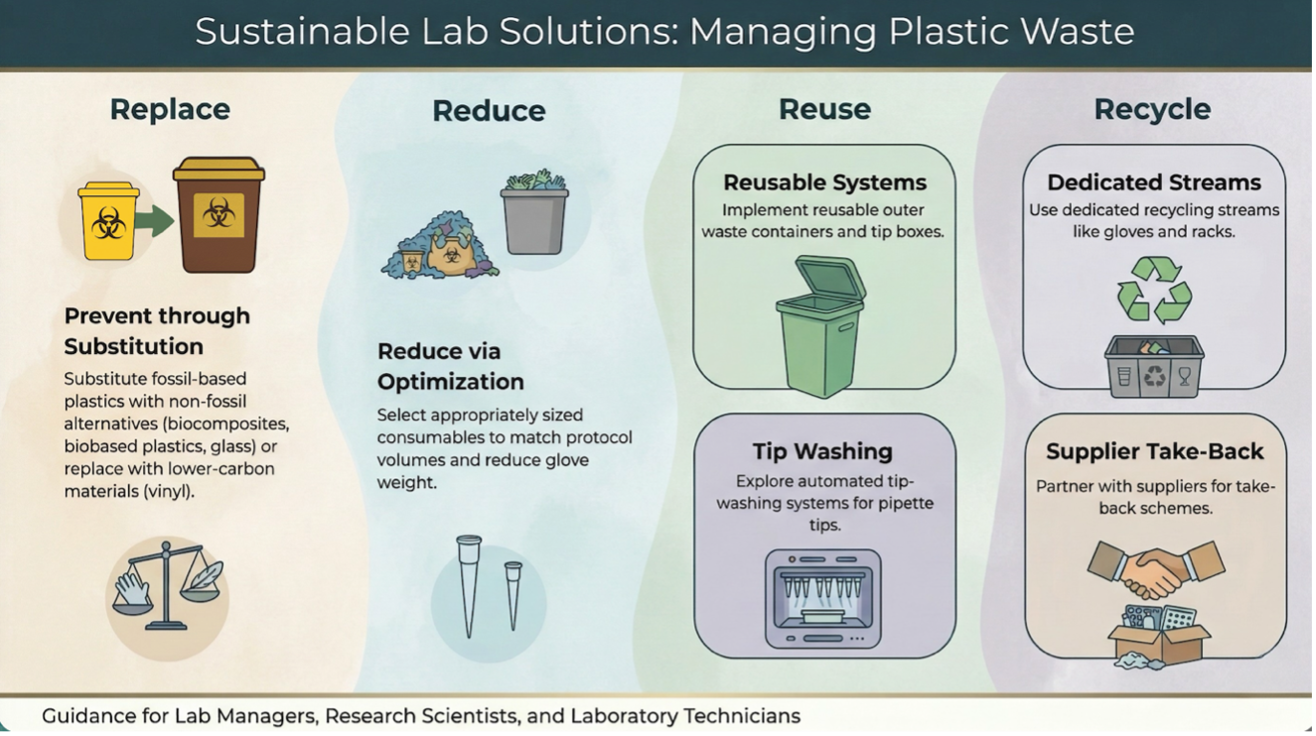
Figure 4: Summary of plastic management in the laboratory space
Conclusion
Over five years, Uppsala University’s laboratories consumed nearly 400 tonnes of plastic, with most of this plastic mass coming from a small number of common consumables. This analysis shows that focusing on a few high-impact product categories will lead to substantial environmental gains. When combined with smarter procurement, more refined waste disposal practices, and behaviour changes, labs can make measurable progress toward more sustainable operations.
My Green Lab, in collaboration with Frostgreen/Woodsafe and Uppsala University, is further analysing waste lab consumables data and assessing how it correlates with supplier data on laboratory plastic use. Additionally, spend‑ and activity‑based data by product category is available through this study, with the results and analysis to be reported in future publications.
Acknowledgements
We are grateful to Margareta Krabbe, Andreas Wallberg, and Mikael Olsson (Uppsala University) for their insightful comments and feedback on this report. We also acknowledge Henrik Alfredsson, David Selin, and Firat Sivaslioglu (FrostGreen) for their valuable contributions and support.